Electricity Priced by the Hour Boosts Distributed Solar Value by a Third or More

In the interest of simplicity, I only looked at the rates PG&E charges for using up to ~250 kilowatt-hours (kWh) per month (their “baseline” rate). But baseline rates only apply to the first 3,000 kWh consumed per year, one-third the U.S. average. Very few customers use so little electricity.
Rather, most customers will consume electricity in Tier 2, which applies to consumption from 3,000 to 6,900 kWh per year, or even Tier 3, which applies to consumption up to 14,500 kWh. And the electricity rates in these tiers are substantially higher.
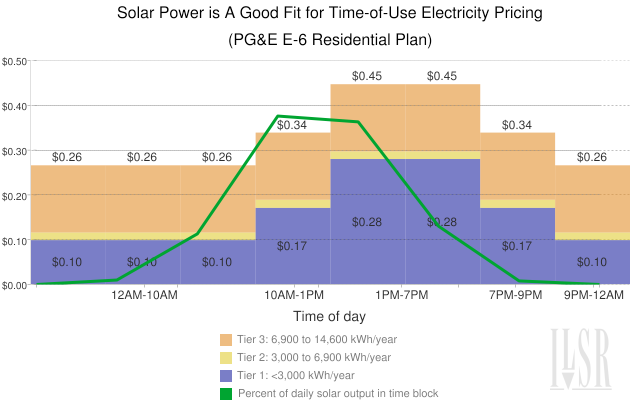
For each peak hour kWh used in Tier 1 (the baseline), a customer pays 28 cents per kWh. But once they’ve used up their baseline amount, each peak kWh will cost 29.6 cents in Tier 2. If the customer hits Tier 3 rates in a given month, their peak electricity will cost 44.6 cents per kWh!
A solar array provides two benefits under this scenario. First, it produces electricity during peak periods, and second, it also reduces overall consumption. Thus, the electricity offset by a rooftop solar array is the most expensive, and it also can push the customer into a lower usage tier, reducing the rate paid on grid electricity.
A few examples:
A customer uses 3,000 kWh per year (the Baseline) and has a 2 kW solar array. The solar array provides 97% of the annual household consumption, and the value of the electricity produced by the solar array (based on the cost of grid power at the time it produces) is 22% higher than under a flat rate plan.
A customer uses 6,900 kWh per year (Baseline and Tier 2 power) and has a 2.5 kW solar array. The solar array provides 53% of the annual household consumption (but nearly all of the Tier 2 electricity), and the value of the electricity produced by the solar array (based on the cost of grid power at the time it produces) is 36% higher than under a flat rate plan.
A customer uses 10,000 kWh per year (Baseline, Tier 2 and Tier 3) – the U.S. average – and has a 2 kW solar array. The solar array provides just 20% of the annual household consumption (but nearly all of the Tier 3 electricity), and the value of the electricity produced by the solar array (based on the cost of grid power at the time it produces) is 253% higher than under a flat rate plan.
The chart at the top illustrates the good matchup between solar and time-of-use rates (the rates shown are for summer weekdays). The bars show the pricing by hour, as well as the higher prices in higher tiers of consumption (for Residential Schedule E-6). The green line shows the percent of daily solar output that falls during a particular time-of-use pricing period.
Overall, solar power is a pretty good fit with time-of-use pricing, a policy that should be used in more locales to improve the economics for local solar power.
You can return to the main Market News page, or press the Back button on your browser.

